
Shiba Inu’s recent price rally has cooled, with the meme coin now trading at $0.000015, down from its weekly high of $0.00001750. According to CoinGecko data, the 24-hour trading volume has dropped significantly, registering $173 million on Sunday—much lower than other meme coins like Dogecoin ($1.416 billion) and Pepe ($933 million).
The declining trading volume is mirrored in the futures market, where open interest has fallen from its peak of $272 million on May 11 to $216 million. This decline suggests that investor demand for SHIB futures is waning, further impacting market sentiment.
Additionally, Shiba Inu’s daily burn rate has dropped by 78% on Sunday, with just 3.3 million SHIB coins burned. Over the past week, fewer than 70 million SHIB tokens have been removed from circulation—a bearish sign, given that token burns typically boost market sentiment by reducing supply.
Moreover, the Shibarium network’s total value locked (TVL) has declined from $3.98 million to $3.41 million, with decentralized applications like ShibaSwap and K9 Finance experiencing asset outflows.
Technical Analysis: Potential for Rebound as Double-Bottom Pattern Forms
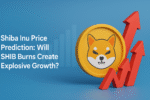
Despite the declining metrics, Shiba Inu’s weekly chart indicates the formation of a double-bottom pattern at $0.00001076. This pattern is often considered a bullish indicator, potentially leading to a breakout toward the November high of $0.00003390—a 133% surge from current levels.
Additionally, the SHIB price is forming the popular harmonic pattern XABCD, with the coin currently in the early stages of the CD phase. If this pattern completes, SHIB could rally to its 2024 high of $0.00004618, representing a 227% gain from current prices.
While short-term bearish indicators such as falling volume and reduced burn rates persist, the double-bottom and harmonic patterns suggest that a bullish breakout could be on the horizon. Investors should monitor the $0.00001076 support level and the $0.00003390 neckline for potential breakout signals.